The Insights Dashboard provides immediate access to vital metrics, enabling you to pinpoint and focus on specific data sets within your inventory. The interface has been designed to provide easy identification of issues relating to storage, object duplication, and compliance risks.
Refining the Dataset
You can refine the dataset by using the Target dropdown. ![]() Click on the dropdown and select from the options of GeoLocation, Host, Repository Type, and Business Unit.
Click on the dropdown and select from the options of GeoLocation, Host, Repository Type, and Business Unit.
Once selected, click the +Set button to display the options available for your selected target. When the selected option is applied, the metrics widgets will update to display data for just the chosen target area.
Metrics Overview
The dashboard consists of a series of widgets displaying visual representations of key metrics. By default, these show metrics for the entire data inventory. However, a filter can be applied to a targeted GeoLocation, Host, Repository Type, or Business Unit to focus on a given area.![]()
- Volume - Total size of stored data and number of objects.
- Age - Created - A bar chart showing the distribution of objects based on how long ago they were created.
- Age - Last Accessed - A bar chart showing the distribution of objects based on the date they were last accessed.
- Age - Modified - A bar chart showing the distribution of objects based on the date they were last modified.
- Scoring - The score breakdown based on your scoring configuration (see Scores Overview).
- Repositories - The distribution of data volume and object count across your repositories.
- GeoLocation - The allocation of data and objects across your hosts' respective geographic locations.
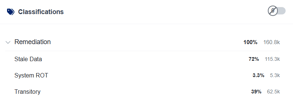
- Classifications - The number of objects that trigger custom metadata classification rules.
To open Insights Builder![]() , click on the button to the right of the Target area.
, click on the button to the right of the Target area. ![]()
Customising the Layout
The Insights Dashboard layout can be customised on a per-user basis. The cards, or widgets, can be re-ordered by dragging and dropping them to the desired position.
Widgets can also be removed from view if they are not required metrics. Simply click on the X on the top right corner of the surplus widget to close it.
Widgets can be restored at any time by going to the Widgets menu and selecting the required category.