
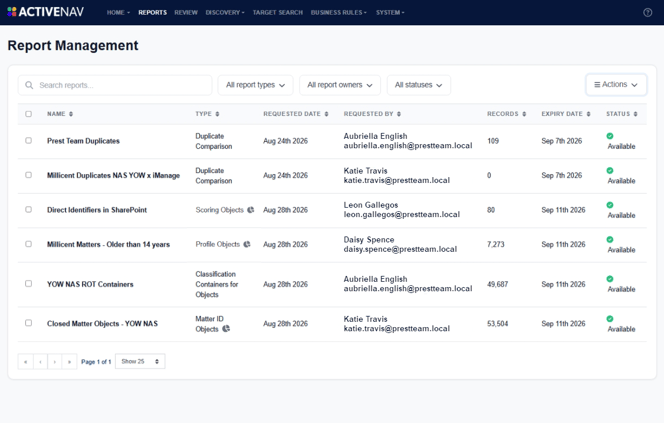
The Reports page presents a list of reports requested about your data in ActiveNav Cloud.
When you click an Export Objects or Export Containers for Objects on Profile, Analyst, or Insights Builder the request is submitted to a background process that generates the report. The report will appear in the list on the Reports page with Status set to Running. The report will be deleted after fourteen days.
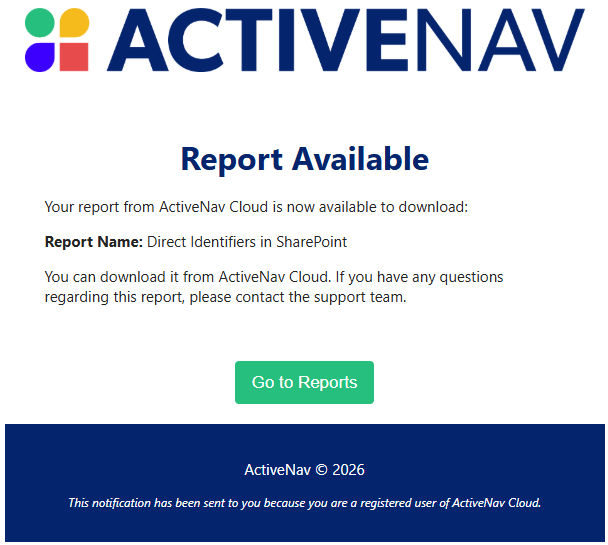
When the report is ready, ActiveNav Cloud will send an email notification with a button that will open the Reports page.
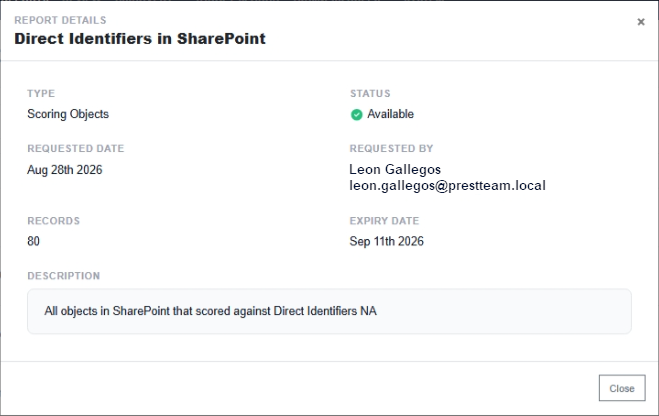
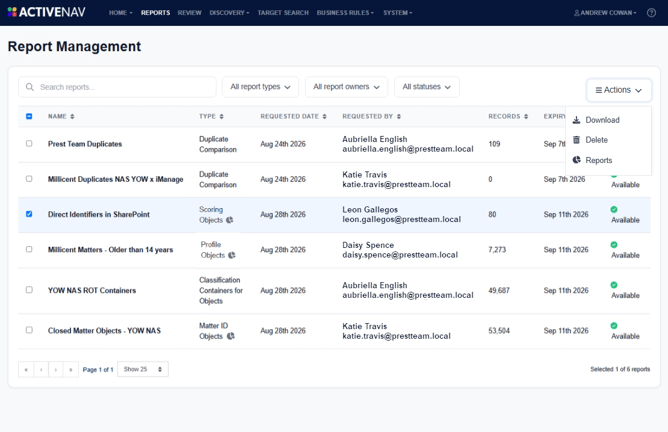
You can view the details of a report by clicking on the entry in the list. If you select the report, the Actions menu allows you to Download or Delete the report. For reports with the pie chart icon, the Actions menu Reports command allows you to launch the Report Visualization tool.
Report Visualization presents a screen with charts about the content of a report.
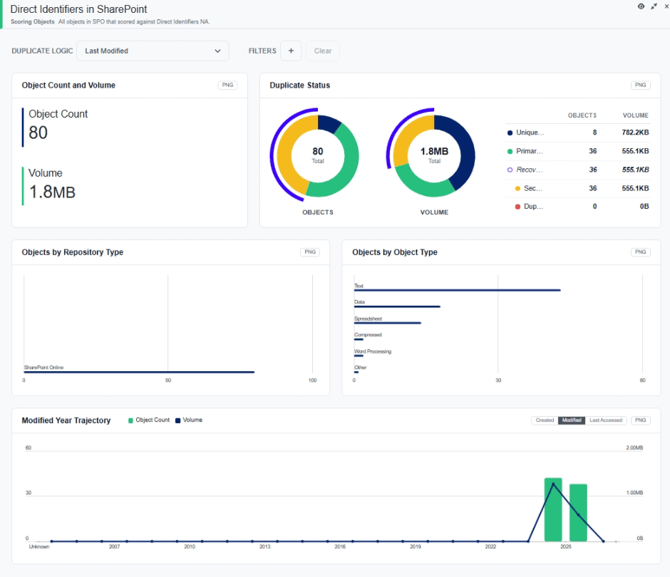
The duplication chart shows the size and count of objects that are unique or duplicated in the report. The duplicate logic selector at the top of the screen allows you to change the method of identifying the Primary Duplicate in a duplicate cluster.
-
Unique - there are no duplicates for these objects in the report
- Primary Duplicate - the identifiable object from a cluster of duplicates as determined by the duplicate logic selected at the top of the screen
- Recoverable - the sum of sum of Secondary Duplicates and Indeterminate Duplicates
- Secondary Duplicates - objects that are duplicates of an identified Primary Duplicate
- Duplicated - Indeterminate - objects where the duplicate logic method was unable to identify a Primary Duplicate
You can use the Filter selector at the top of the screen to filter graphs by Business Unit, Repository Type, Host, Geographical Location, Object Type, and Duplicate Type. You can also set filters by clicking on the elements of a chart.
The charts show the object count and volume (by size) for the whole report, broken down by repository type, and object type. Breakdown by age is displayed as a dual chart for the object count and volume by year. You can choose to use Created, Modified, or Last Accessed for the date chart. Each chart has a PNG button that allows you to copy the graphic for use elsewhere.
For a guide on viewing CSV data in Excel, please see the knowledgebase article here .
.